
The simulation provides quantitative access to the time course of the reaction. In the simulation, 20 mL of 0.2 M hydrochloric acid reacts with magnesium. The resulting volume of hydrogen is recorded as a function of time and displayed graphically.
Mass of magnesium [g]
Simulation notes
The selected playback speed only changes the pace of the display. The time shown is simulation time.
The magnesium mass can be changed before the simulation starts or after it has finished or been reset. The mass control is locked while the simulation is running or paused.
“Measurements” is unlocked only after a complete run and locked again when starting a new run or resetting. Once unlocked, you can enter your own measured times from the real experiment in the “Measurements” tab and compare them with the simulation.
The “Model prediction” shows the reaction course expected by the model for the newly selected magnesium mass. The previously completed simulation run remains visible for comparison.

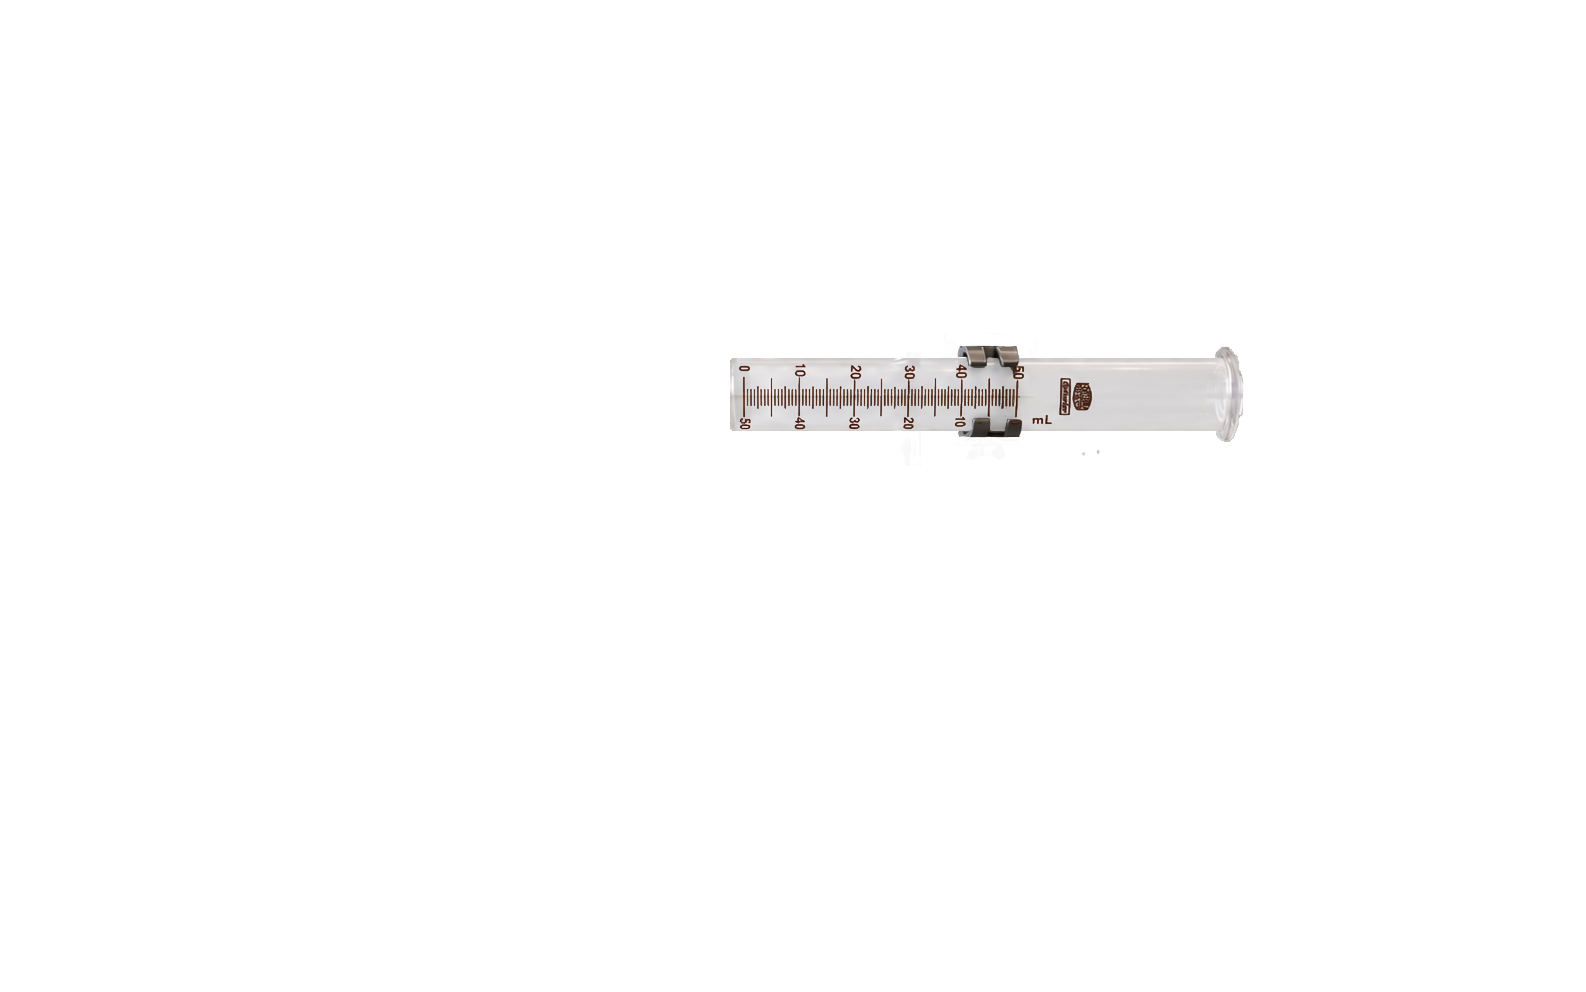
Enter the measured times. The table and diagrams are updated when you select “Calculate”.
| No. | t [s] | V(H2) [mL] | n(H2) [mol] | n(H₃O⁺) [mol] | c(H₃O⁺) [mol L-1] |
|---|